AgriClime Sentinel
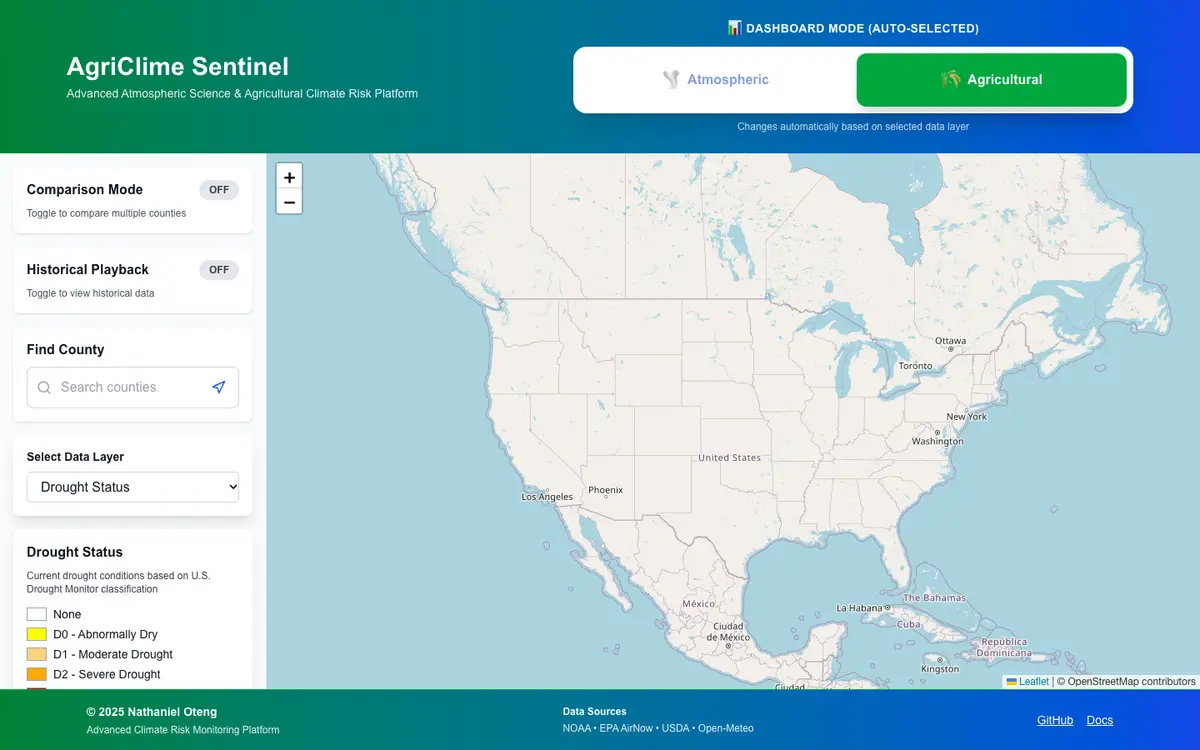
A dual-mode climate dashboard that combines agricultural risk assessment with atmospheric science for every county in the United States.
- U.S. counties
- 3,221
- of historical data
- 55 years
Why it exists
Farmers, planners, and researchers need drought, weather, and crop-risk signals at county level, with enough history to see real trends. AgriClime brings those signals together on one map to support food supply resilience.
What it does
The features that matter.
- 01Drought, soil moisture, and crop-risk layers
- 02NEXRAD radar, weather alerts, and severe weather indices
- 03Historical climate playback
- 04Side-by-side comparison of multiple counties
- 05Interactive Leaflet map with county search
Built with
- Climate
- Agriculture
- TypeScript
- Next.js
- Geospatial
- Data visualization
- Risk assessment
- Atmospheric science
Data from NOAA, EPA AirNow, USDA, Open-Meteo.
An advanced atmospheric science platform for climate monitoring and risk assessment in U.S. agriculture. Features real-time weather data visualization, historical climate playback, multi-county comparison tools, interactive geospatial mapping with Leaflet, comprehensive drought monitoring, and detailed risk assessment analytics. Built to help stakeholders make data-driven decisions for agricultural security and food supply resilience.